
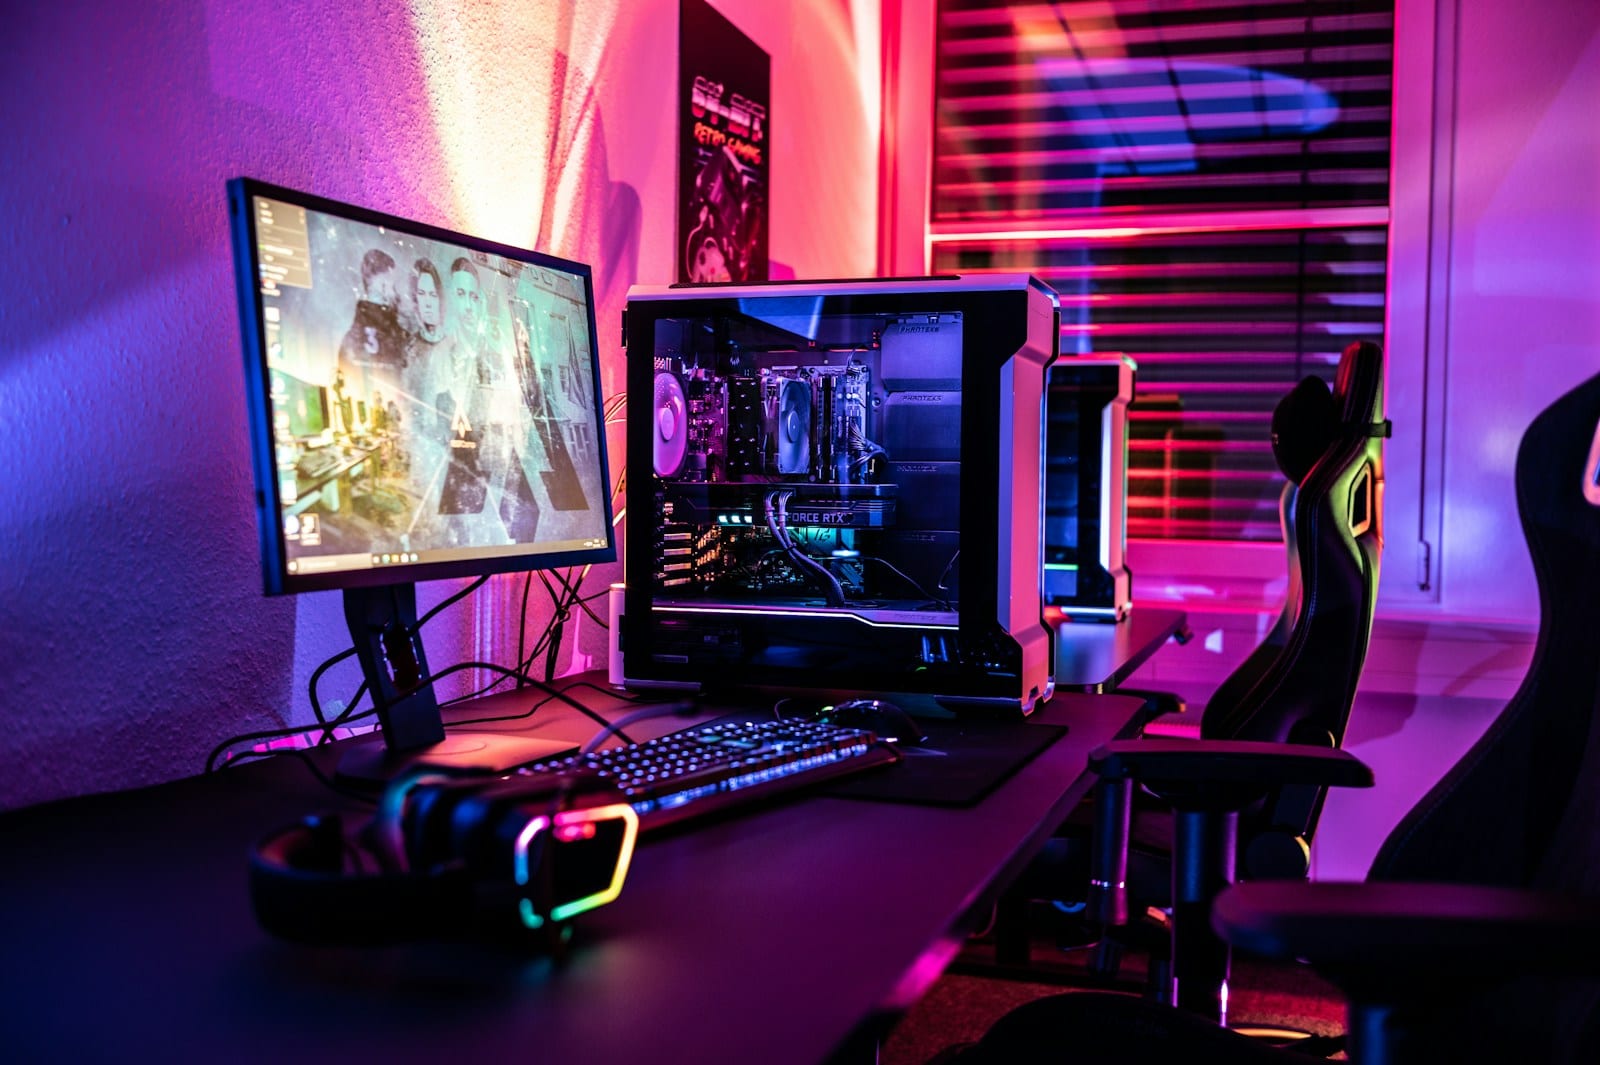
An average does not show how frames arrive
A game can average 100 FPS while pausing briefly every few seconds. The average combines fast and slow frames into one number, allowing several unpleasant drops to move it very little. A 1% low result tries to describe the roughest part of a run without reducing the entire test to its single slowest frame.
NVIDIA defines its metric as the average of the slowest 1% of frames. If average performance is 100 FPS and the 1% low is 45, a small part of the run took much longer to render. That does not identify the cause by itself, but it confirms uneven delivery.
Frame rate and frame time describe the same delivery
FPS counts how many frames fit inside one second. Frame time measures how many milliseconds each one takes. At 60 FPS, the budget is 16.67ms per frame. At 120 FPS, it falls to 8.33ms. One 50ms spike feels like a hitch even when the one-minute average remains high.
A frame-time graph can therefore diagnose more than the final number. A stable line feels smooth. Isolated spikes reveal pauses, while a sustained rise points to a different workload. Our FPS versus refresh-rate guide explains how that cadence relates to the display.
A 0.1% low looks at an even smaller portion and may capture the worst events, but it is also more sensitive to a loading screen, notification or scene transition. It becomes useful across long, repeatable tests. In a short run, one accident can become the conclusion.

How to compare two settings without misleading yourself
Use the same save, route, resolution and settings. Let shader compilation finish, stop downloads and record several runs of similar length. Compare average FPS, the 1% low and the frame-time plot. One pass can favor either setup by chance.
A small and consistent gap between average and 1% low is usually preferable to a spectacular peak with deep drops. There is no universally good percentage because every engine, scene and frame cap changes the distribution. A cap slightly below the maximum can improve consistency when it prevents the CPU or GPU from sitting at its limit.
If sharply reducing resolution raises the average but leaves the spikes, investigate the CPU, asset streaming, shaders and background tasks. Our CPU and GPU bottleneck guide provides a repeatable test. If hitches appear when entering new areas, shader compilation may be responsible instead of insufficient GPU power.

The conversation starts here
Sign in with a supporter account to comment. Sign in
Nobody has commented yet. Want to go first?