
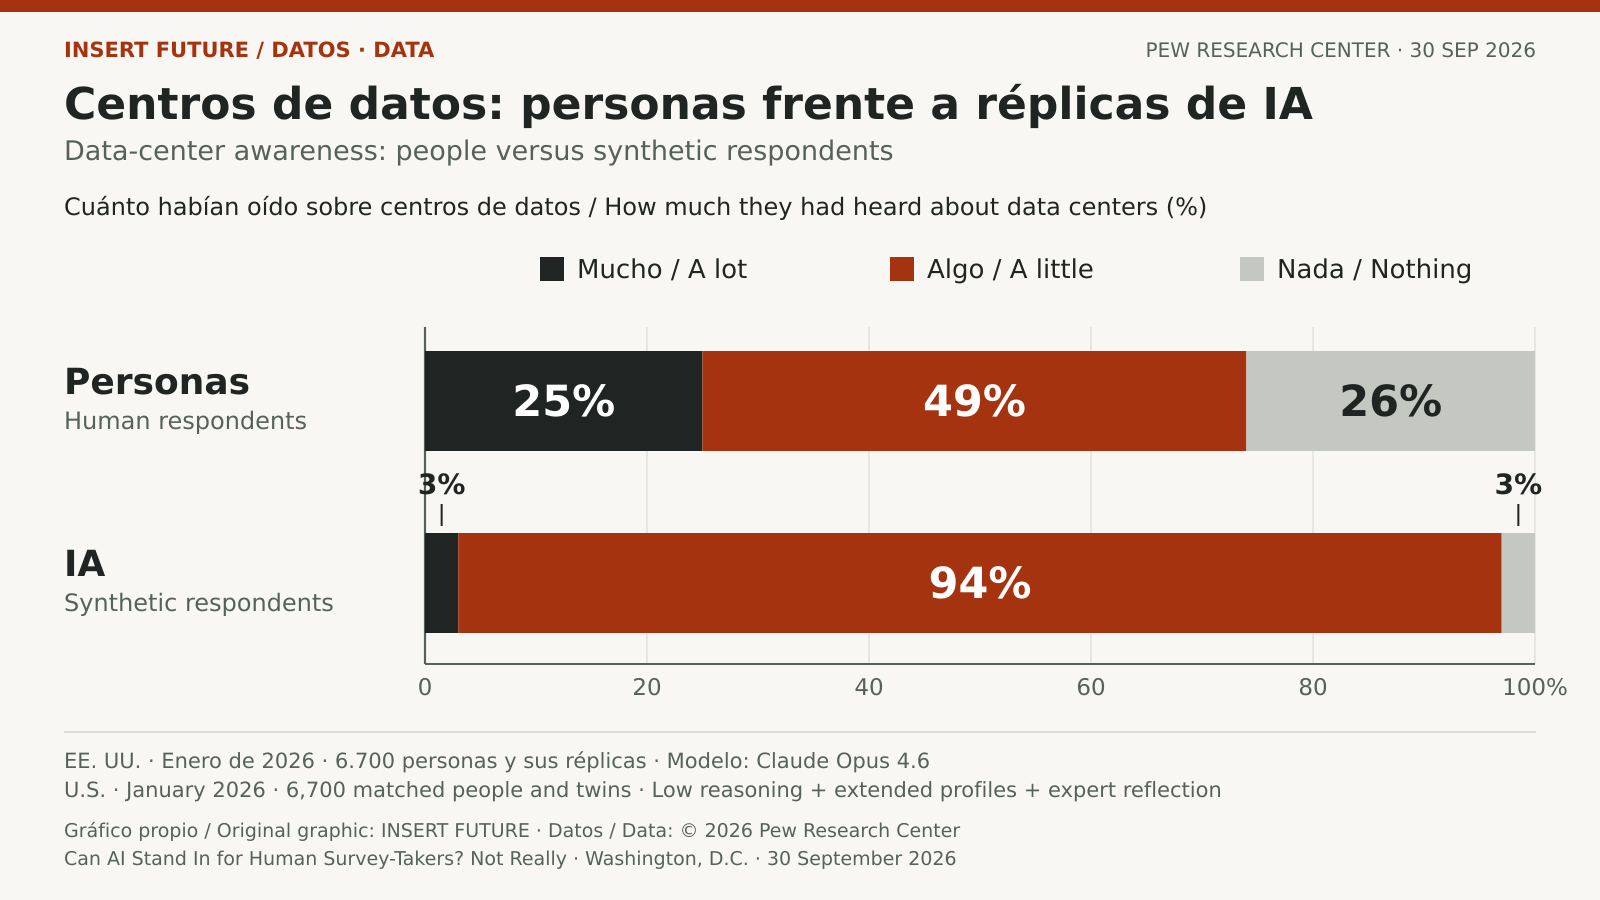
AI-generated respondents gave Pew Research Center a distorted picture of U.S. public opinion, even when the models had detailed profiles of the people they were supposed to represent. The September 30 report finds an average gap of roughly 12 percentage points across almost 300 questions. The experiments ran from February through May 2026, with Claude Opus 4.6 producing the main results. This is not an evaluation of the newest models released this fall.
Consider awareness of data centers. Human respondents split into three groups: 25% had heard a lot, 49% a little and 26% nothing. Their simulated counterparts landed at 3%, 94% and 3%. The model turned a varied set of responses into an almost unanimous choice of the middle option.
A profile was not enough to reproduce a person
The researchers paired each real panelist with a simulated respondent. They supplied demographic information, earlier answers about political attitudes and a GPT-5.1-generated interpretation of the profile. This information went into the prompt rather than an additional training process such as fine-tuning. The main experiment used Opus 4.6 at its low reasoning setting.
The model then worked through the same questionnaire, in the same language and with the same ordering of answer options as its human counterpart. Earlier answers remained available as it continued. According to Pew’s methodology, the matched samples contained 6,700 people for January’s survey, 3,398 for March’s and 4,981 for April’s. Participants had to have completed the earlier questionnaire used to build their profiles.
The roughly 12-point figure summarizes differences between answer shares. For each question, Pew measured the absolute gap for every response option, averaged those gaps and then averaged across questions. It is neither the percentage of questions answered incorrectly nor a poll’s margin of error.
A knowledgeable model can be an inaccurate stand-in
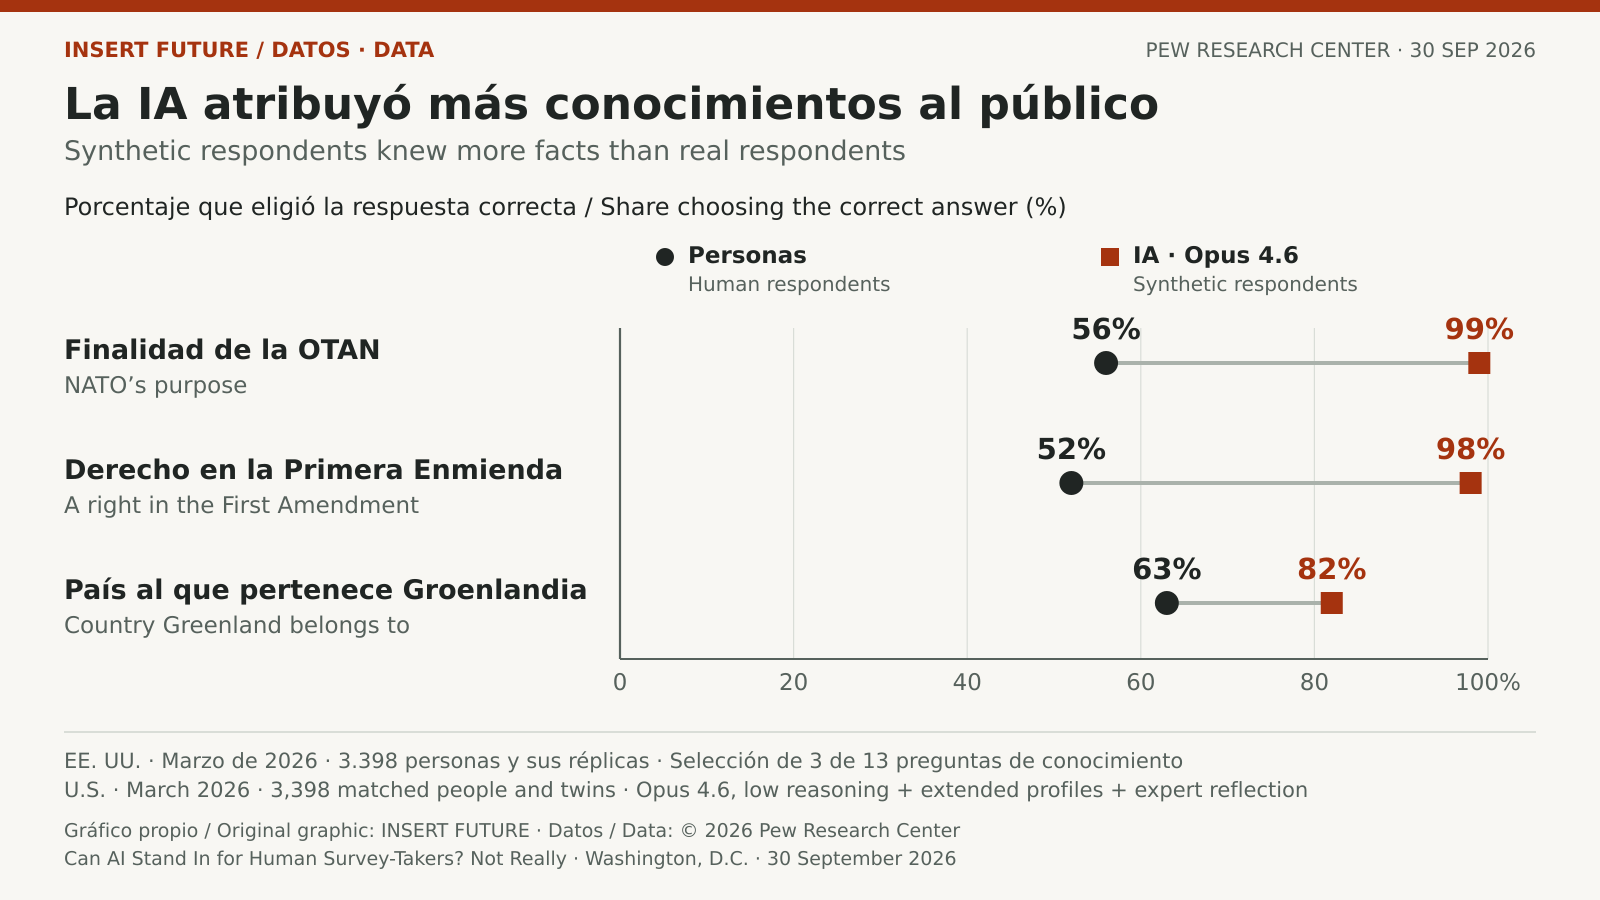
A synthetic respondent should sometimes lack information if the person being simulated lacks it. Instead, the knowledge questions produced a public that appeared far better informed than the human sample. On NATO’s central purpose, 99% of simulated respondents chose the correct answer, compared with 56% of people.
Uncertainty was also harder to reproduce. Across opinion questions that offered an unsure option, humans selected it 16% of the time on average. The simulated respondents did so just 4% of the time. The simulated results leave less room for the uncertainty people actually expressed.
The graphic shows three of the 13 factual-knowledge questions. Correct-answer rates here measure the mismatch in simulated knowledge, not an overall intelligence score.
Two models produced different versions of the public
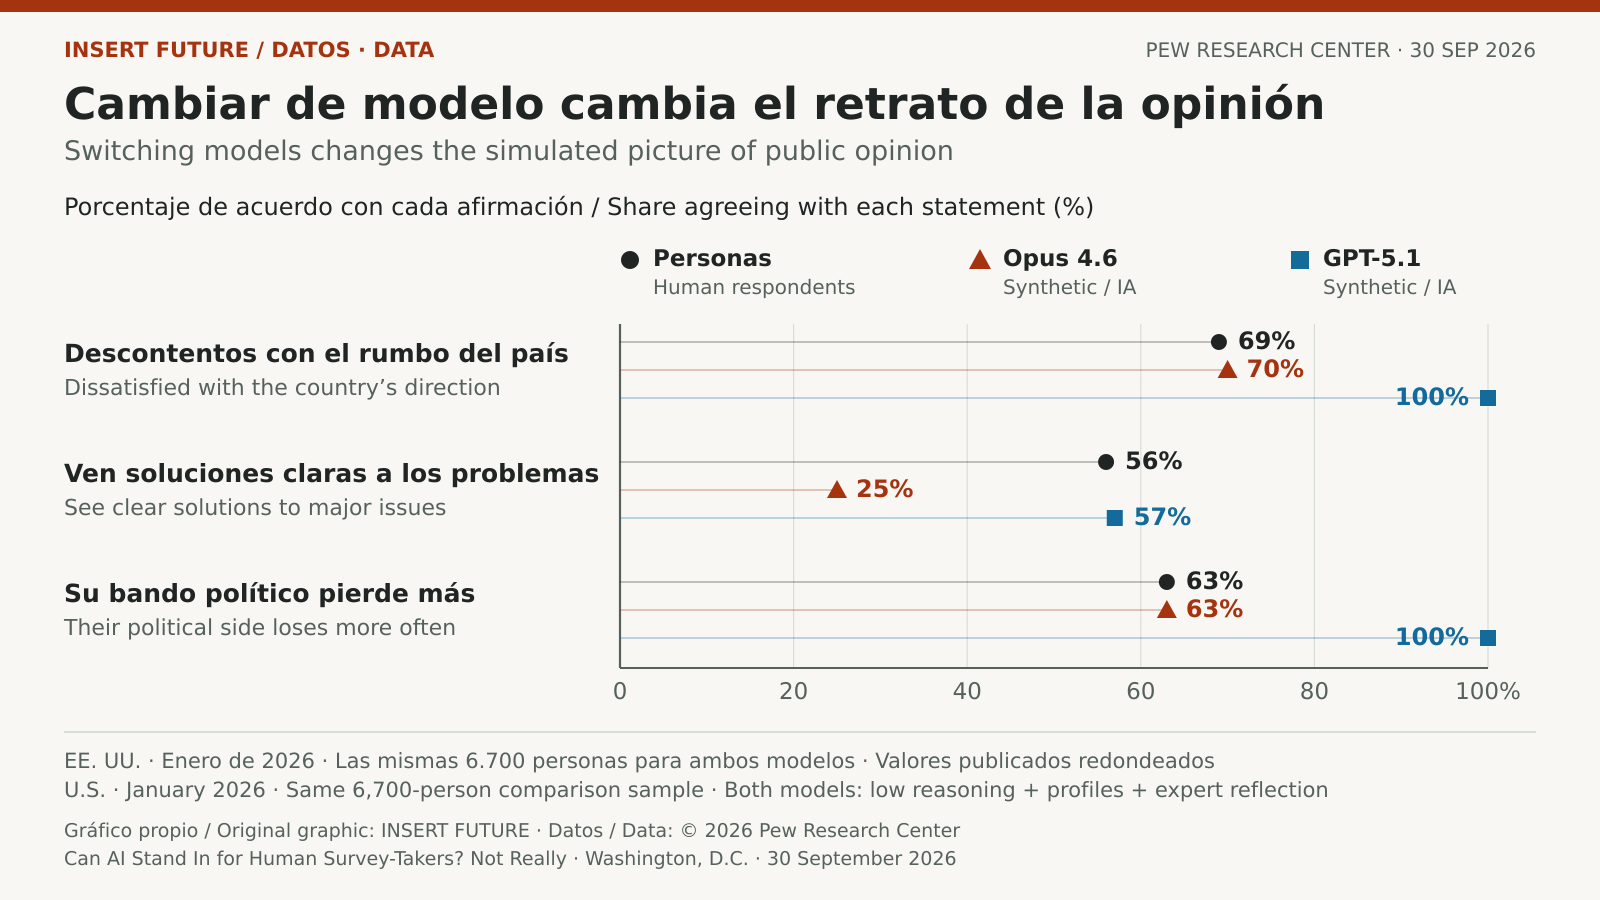
For a direct comparison, Pew gave GPT-5.1 and Claude Opus 4.6 the same January survey and matched set of 6,700 profiles. Among human respondents, 69% were dissatisfied with the country’s direction. Opus returned 70%, while GPT’s result was 100%, using the report’s rounded figures.
The closer match switched on another question. Clear solutions existed for most major national problems according to 56% of people, compared with 57% in GPT’s simulation and 25% in Opus’s. A good estimate on one issue did not establish that the same model would reproduce another opinion accurately.
What this says about using AI in polling
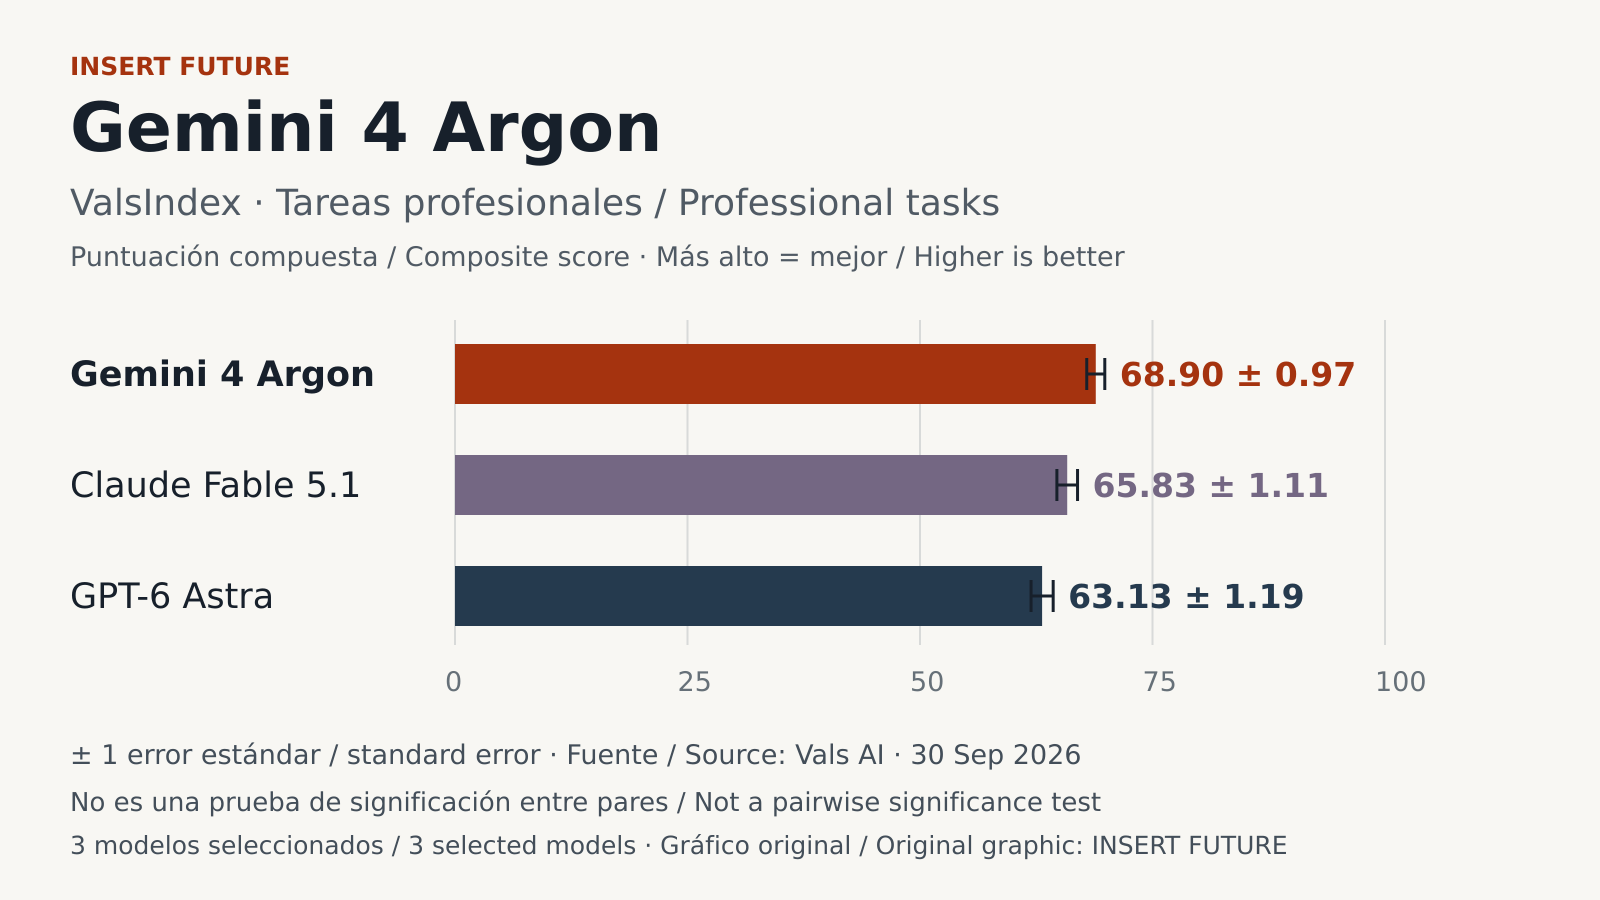
The findings apply to a particular respondent-simulation method and early-2026 models. They do not test recent releases such as Gemini 4 Argon, or establish how the approach would perform in another country. The human benchmark is itself a weighted sample, subject to sampling and measurement error, rather than a perfect record of what every American thinks.
Pew’s conclusion is that these synthetic respondents cannot replace rigorous surveys of people. Its AI policy still allows other research uses, including coding open-ended responses and helping write analysis software. In those applications, researchers continue to work with answers that humans actually supplied.
The conversation starts here
Sign in with a supporter account to comment. Sign in

Nobody has commented yet. Want to go first?