
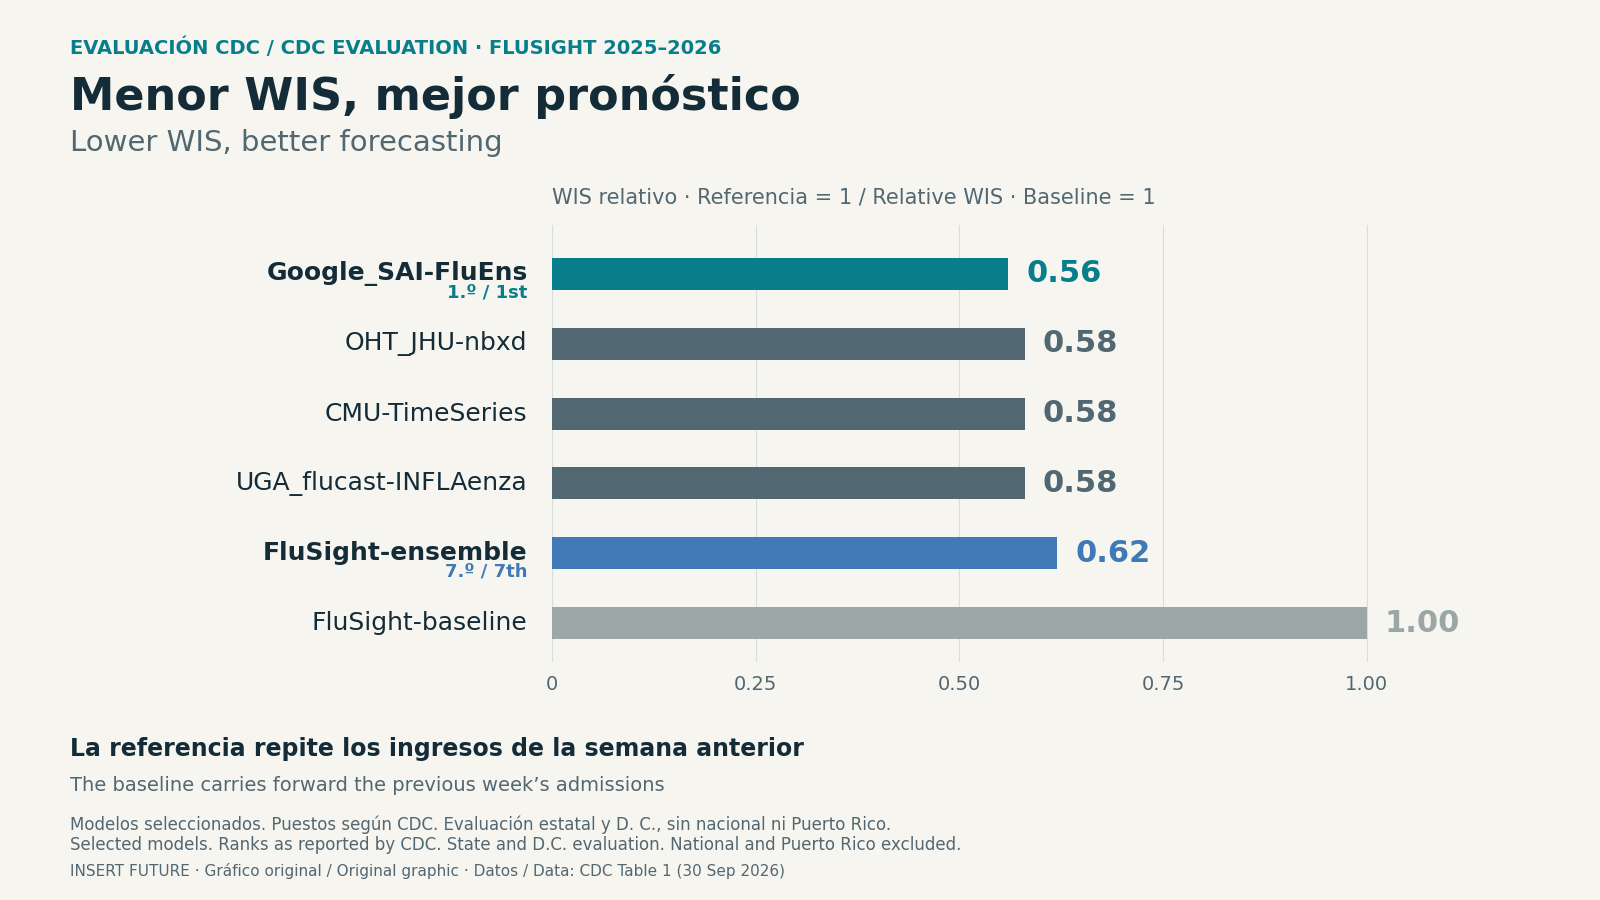
An AI-assisted system from Google produced the best-ranked flu hospital-admission forecasts in the CDC’s newly published review of the 2025–26 season. Google_SAI-FluEns combines predictions from software built with language-model assistance. Teams submitted forecasts for the current week and the next three weeks, before the eventual hospital counts were known.
For hospitals, useful advance warning can mean time to prepare beds, staffing and treatment supplies. The CDC describes those planning needs as a reason to develop flu forecasts. This review assesses population-level predictions, rather than diagnosing patients or testing whether using Google’s system improves clinical outcomes.
First place on a particular forecasting measure
Google recorded a relative weighted interval score, or WIS, of 0.56 in the CDC’s results table. The FluSight ensemble used for the agency’s forecast messaging scored 0.62. Lower is better, with 1 representing a simple baseline that carries the latest observed admission count forward. Both systems beat that baseline.
WIS weighs prediction error alongside the uncertainty ranges a model provides. Very wide ranges are less useful, even if they often contain the eventual result. Narrow ranges incur penalties when the real number falls outside them. A score of 0.56 therefore does not mean 56% of forecasts were correct, or translate directly into a universal accuracy improvement.
The ranking covers the 50 states and Washington, D.C. Counts are transformed to limit how much larger jurisdictions dominate the comparison. National and Puerto Rico forecasts are excluded, and eligibility requires submissions for at least 75% of the expected forecasts. The result describes performance during this season, with these data and rules.
Language models built the forecasting code
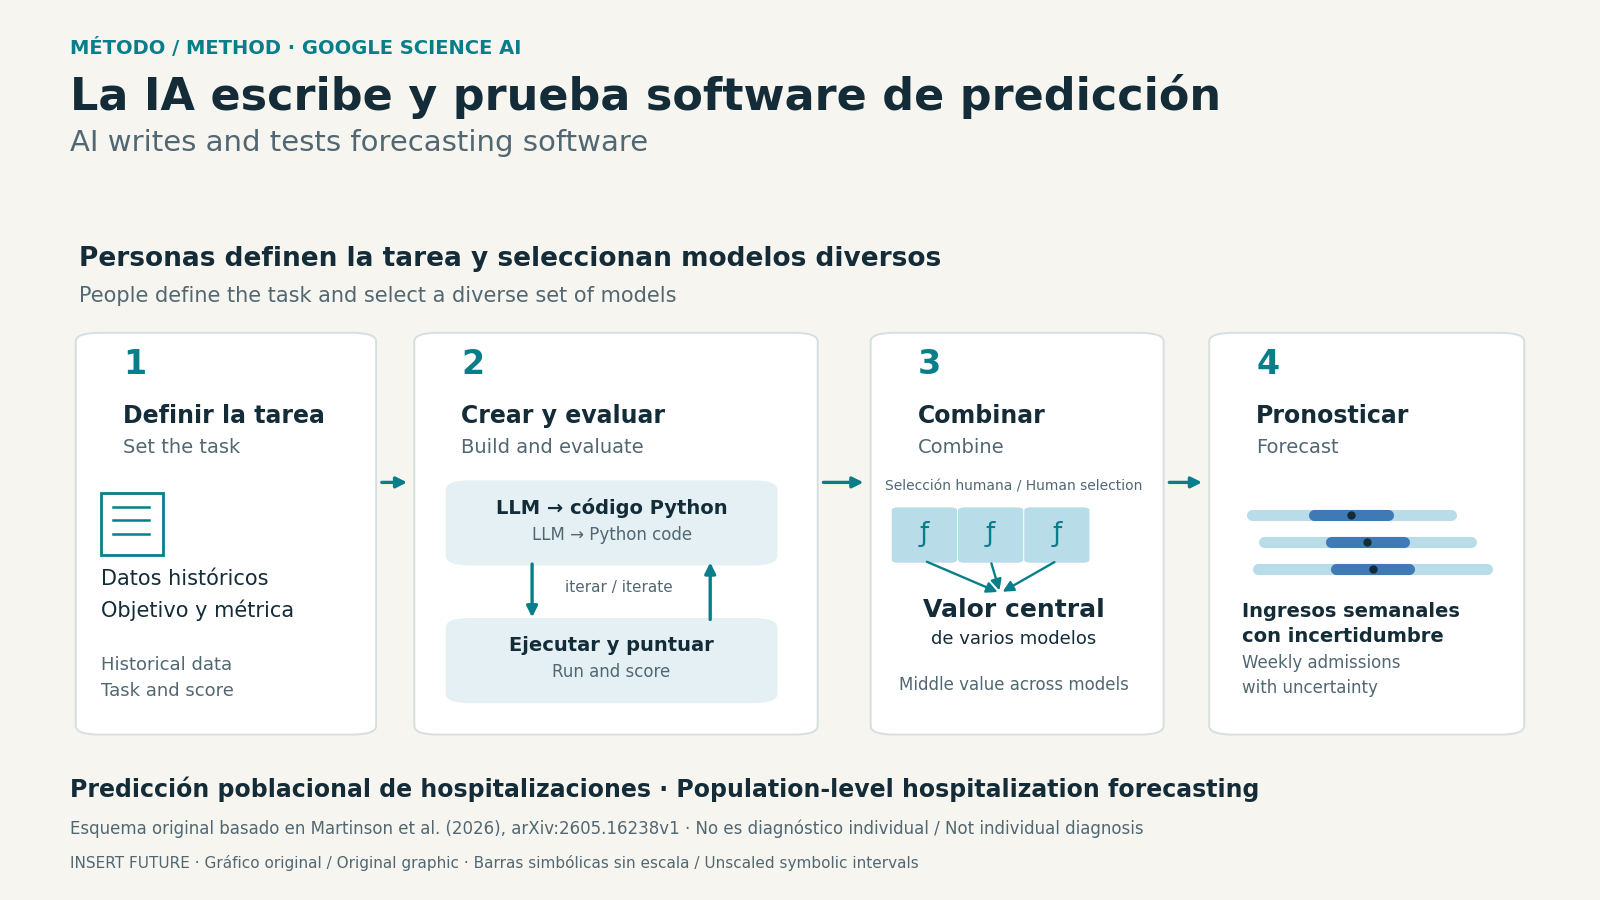
The researchers explain the process in a May preprint. Their Empirical Research Assistance system, ERA, gives a language model historical data, a task and a way to test candidate software. It writes code, runs it, examines the score and tries revisions. This is an example of an AI agent using tools to work toward a measurable goal.
Some instructions described established epidemiological methods. Others encouraged the system to combine approaches or explore alternatives. Researchers selected programs and combined their predictions into an ensemble. Weekly, time-stamped submissions then tested those forecasts against future observations. That live test addresses a different question from how well code can fit an already completed season.
How well did the uncertainty ranges hold up?
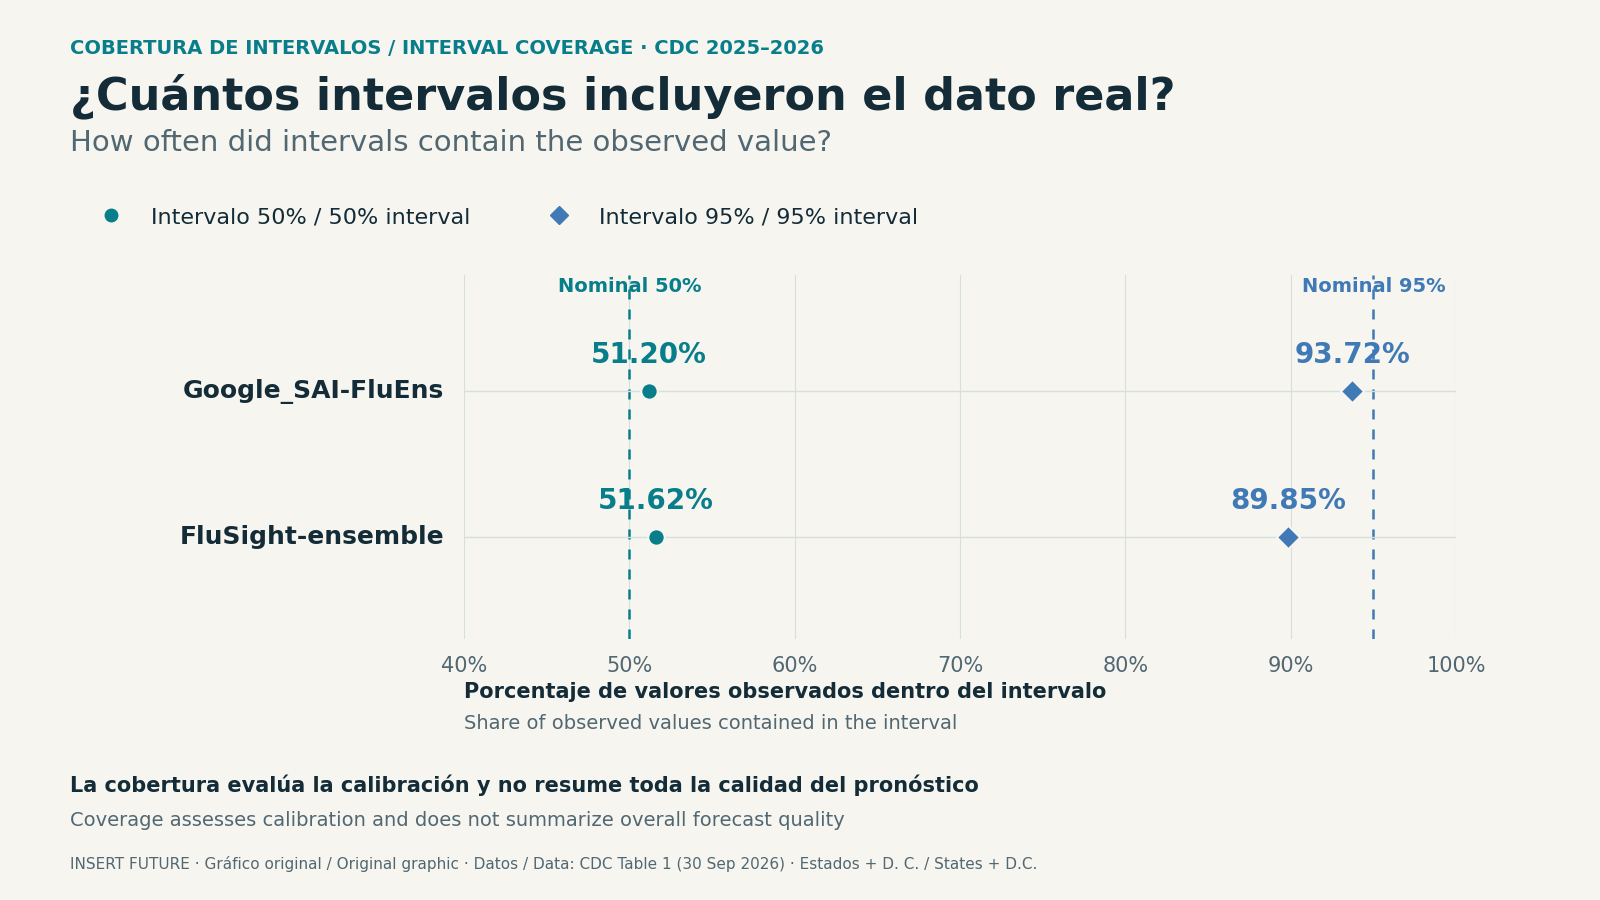
A 95% prediction interval is intended to contain the eventual result in about 95 out of 100 comparable cases. Google’s ranges did so 93.72% of the time, compared with 89.85% for the FluSight ensemble. These figures measure coverage, not exact predictions. Google submitted 98% of expected forecasts and the CDC ensemble 100%, so their coverage figures do not come from identical samples.
As with AI weather forecasts such as WeatherNext, strong average performance can coexist with missed turning points. The CDC says its own ensemble struggled during rapid increases and decreases in hospital admissions this season. That finding concerns the CDC ensemble and is not a separate measurement of Google’s system.
In its September 30 announcement, Google links the result to its scientific AI work. ERA’s underlying technology remains available to trusted testers through experimental research tools. Future seasons will test whether the forecasting gains carry over to conditions the system has not yet encountered.
The conversation starts here
Sign in with a supporter account to comment. Sign in
Nobody has commented yet. Want to go first?